“A map should be aesthetically pleasing, thought-provoking, and communicative.”
Founder of today's Cartography Center
Arthur H. Robinson
Tracing its roots to October 1941, CIA’s Cartography Center has a long, proud history of service to the Intelligence Community (IC) and continues to respond to a variety of finished intelligence map requirements. The mission of the Cartography Center is to provide a full range of maps, geographic analysis, and research in support of the Agency, the White House, senior policymakers, and the IC at large. Its chief objectives are to analyze geospatial information, extract intelligence-related geodata, and present the information visually in creative and effective ways for maximum understanding by intelligence consumers.
Since 1941, the Cartography Center maps have told the stories of post-WWII reconstruction, the Suez crisis, the Cuban Missile crisis, the Falklands War, and many other important events in history.

President George W. Bush receives a briefing during meeting with CIA Director George Tenet, right, National Security Advisor Condoleezza Rice, and Chief of Staff Andy Card at Camp David, Saturday, September 29, 2001
The First Map:
On July 11, 1941, President Franklin D. Roosevelt established the United States’ first peacetime, non-departmental intelligence organization, the Office of the Coordinator of Information (COI), and authorized it to collect and analyze all information and data relevant to national security. COI, headed by William “Wild Bill” Donovan, reported directly to the President. Donovan recruited the best and the brightest from universities, businesses, and law firms focused on foreign affairs or with experience abroad.

President Roosevelt with one of the rare OSS-made globes.
One of those recruited as a map consultant was 26-year-old Arthur H. Robinson, a graduate student who had recently begun working on his Ph.D. in geography. He started in the Geographic Division of the COI’s Research and Analysis Branch on October 16, 1941, and shortly thereafter produced its first map and was asked to start the Cartography Section. This marked the inception of CIA’s present-day Cartography Center.
After the Pearl Harbor attack on December 7, 1941, COI expanded rapidly and its maps began to circulate widely. Robinson was joined by geographer Robert Voskuil, and the two focused on recruiting staff, procuring equipment, and developing training procedures. By February 1, 1942, the Cartography Section was fully operational, with Robinson serving as its chief. The Map Information Section was added to procure commercial maps, for use by cartographers and to reproduce for policymakers.
OSS and Cartography:
With wartime needs requiring its expansion, COI grew from an office into America’s first intelligence agency and was replaced by the Office of Strategic Services (OSS) on June 13, 1942. To satisfy a dramatic increase in the demand for customized thematic maps for the President, Joint Chiefs of Staff (JCS), Joint Army Navy Intelligence Studies (JANIS), Board of Economic Warfare, and COI, the Cartography Section added 28 geographers by the end of 1942.

CIA hand-rendered terrain map
At that time, there were no cartographers as we know them today—so Robinson recruited geographers with an interest in mapping, and they learned on the job. Robinson developed a unique system of map production to operate in the field of intelligence, and it evolved rapidly to improve map quality and production efficiency.
In March 1943, the Topographic Models Section was added, and the three sections—Cartography, Map Information, and Topographic Models—formed the new Map Division. Geographers and cartographers amassed what would be the largest collection of maps in the world and produced strategic maps and 3D plaster terrain models in support of strategic studies and military operational plans for the JCS, the Office of Naval Intelligence, OSS, and the War Department.
The Map Division was intimately involved in the planning strategy of the Allied invasion of North Africa and Italy. It also assessed the economic and topographic conditions in other areas vital to the conduct of the war, including in the Asia-Pacific theater. The JCS called upon cartographers for much of their secret security work concerning operations and valued cartographers for their support at the Allied conferences.
Cartography Moves to CIA:

Serving as the premier source for strategic thematic maps and map resources, the Cartography and Map Information Sections survived the abolishment of OSS on October 1, 1945 and were transferred to the Division of Geography and Cartography in the Department of State.
The Cartography Section would remain at the State Department until July 1, 1947, when it was transferred to the Central Intelligence Group (CIG).
Shortly thereafter, CIG gained the status of a full agency and became the Central Intelligence Agency on September 18, 1947. Serving a unique need with world-class products, Cartography Center has withstood many reorganizations and name changes in the past 75 years and continues to provide timely and effective map services in support of a variety of national security topics.
* * * * *
The 1940s
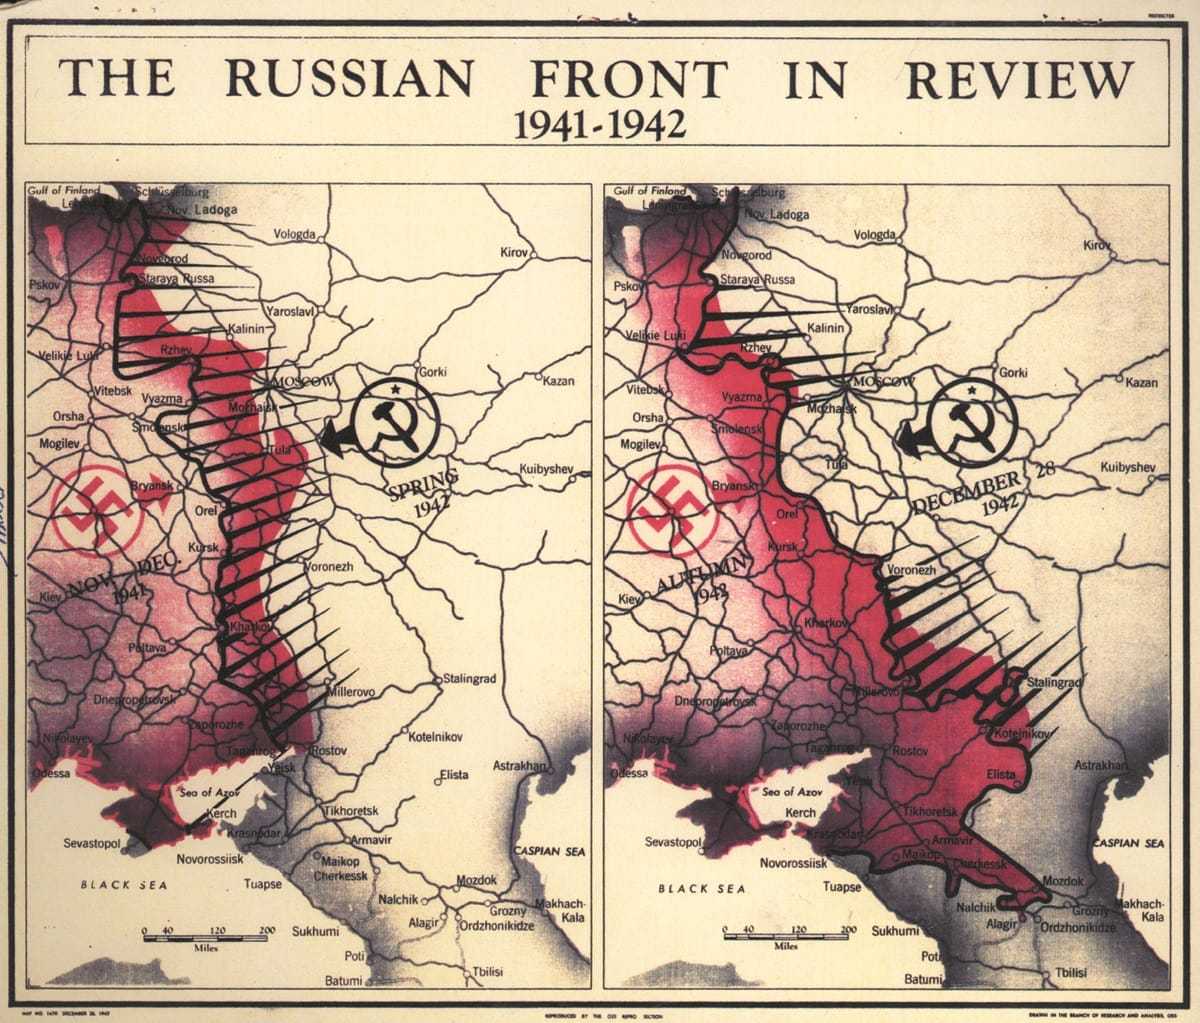
1942 OSS map: Russian Front.
In the early 1940s, map layers were drafted by hand using pen and ink on translucent acetate sheets mounted on large Strathmore boards. They were drafted at larger sizes than needed for the final (typically at a 4:1 ratio) and printed at a reduced size using photomechanical methods. Standard symbols and labels preprinted on adhesive-backed cellophane sheets called “stick-up” were applied to maps for uniformity.
During this decade, in support of the military’s efforts in World War II (WWII), cartographers pioneered many map production and thematic design techniques, including the construction of 3D map models. Cartographic support was key to the US war-planning strategy. In addition to the major events of WWII, during the 1940s, cartographic production was primarily driven by postwar reconstruction, turmoil in the Middle East, and communist expansion.
The 1950s
The 1950s witnessed improved efficiency in map compilation and construction processes. Map layers were drafted in pen and ink on vinyl sheets for photomechanical reproduction, and type was handset using precast lead letters. Cartographers then learned scribing techniques to produce high-quality line-work for maps and adapted shaded relief techniques to better depict the nature of the terrain on maps.
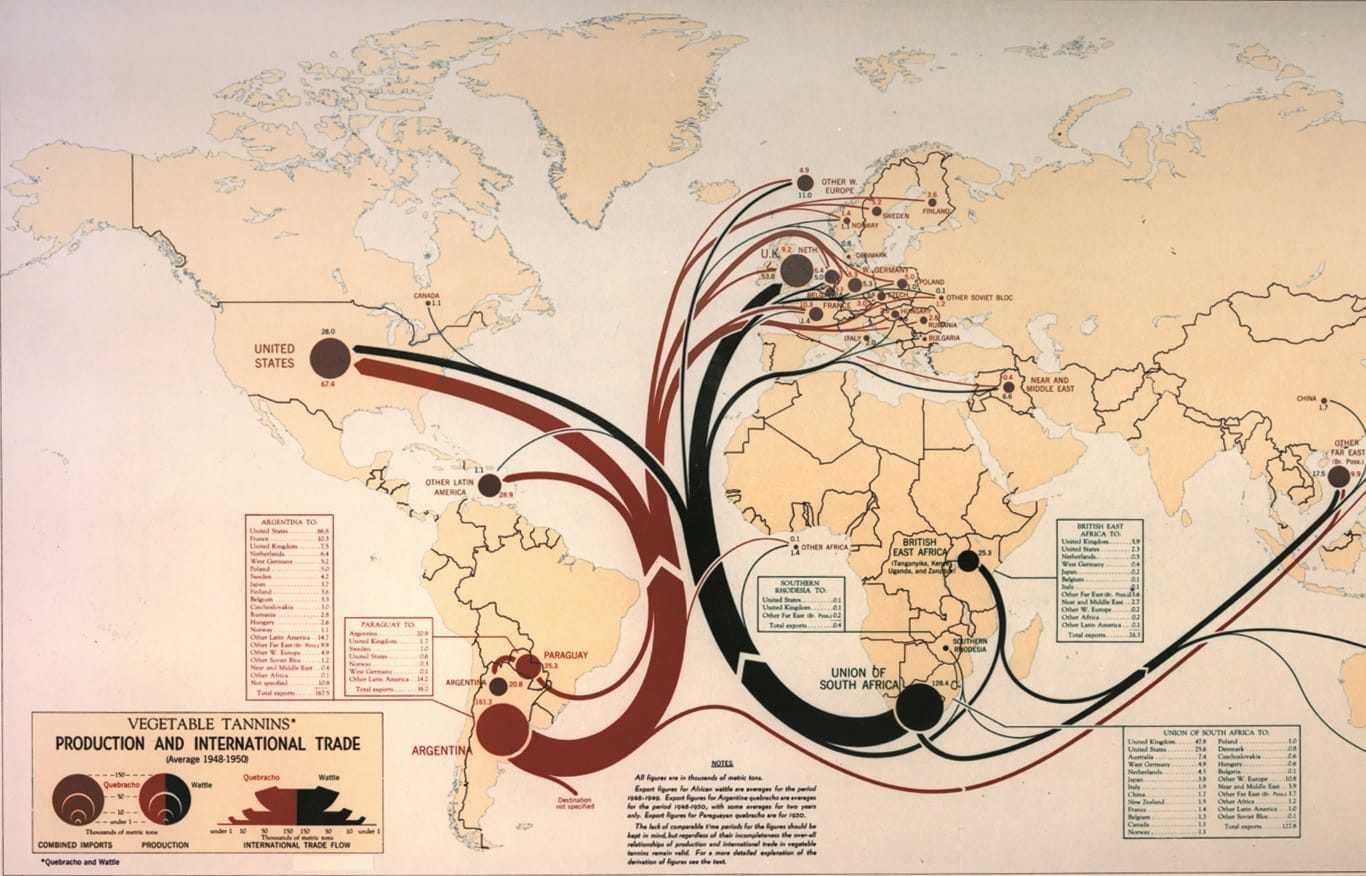
1950 CIA Map: International Trade
As production capabilities improved to turnaround times of less than one day, a small group of cartographers and graphic designers from the Cartography Division was placed in the Cartographic Support Section to work specifically on current intelligence—daily analysis prepared for the President and other selected senior US officials.
During the 1950s, cartographic production was primarily driven by the Cold War, the Korean war, the French defeat in Vietnam, the Suez crisis, and the rise of the Castro regime in Cuba.
The 1960s
In 1965, the Director of Central Intelligence actively encouraged analysts to use visual arts to help explain complex problems. The Vietnam War also generated an increase in demand for maps.

President Kennedy with CIA map. 1961.
In 1966, a large working group, using a borrowed digitizer, compiled and digitized coastlines and international boundaries for the entire world—in a single weekend. This digital geographic database, World Data Bank I (WDBI), contained more than 100,000 vertices that could be projected using the Cartographic Automatic Mapping (CAM) program. This eliminated the need for hand scribing graticules and coastlines, drastically expediting map production.
During the 1960s, cartographic production was primarily driven by the continuation of the Bay of Pigs invasion, the Cold War, the Cuban Missile Crisis, the Six-Day War, the Soviet expansion, US involvement in Vietnam, and the advent of numerous African countries gaining independence.
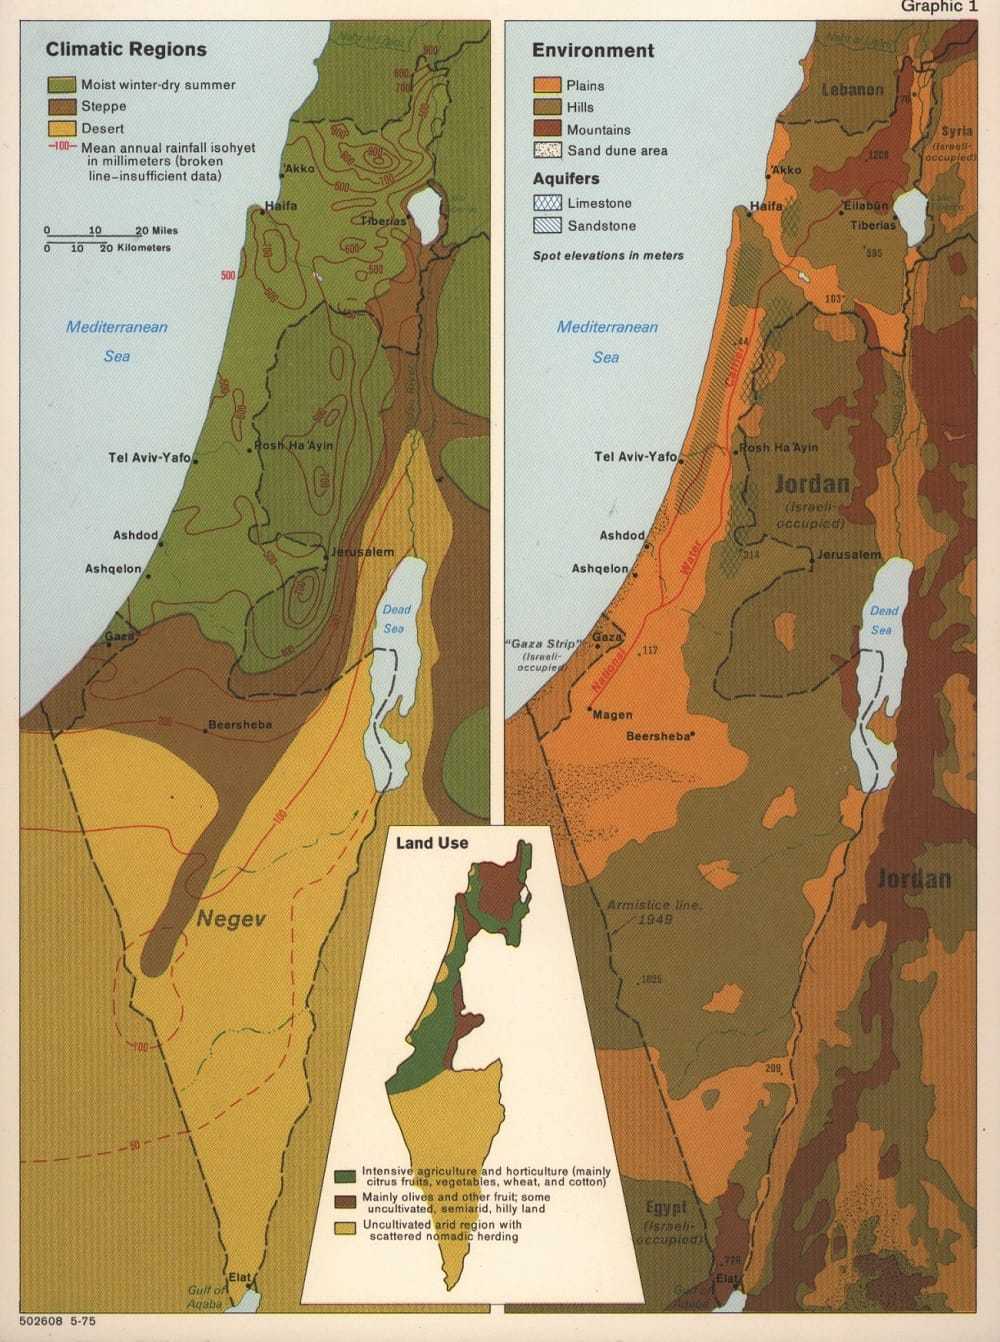
CIA map of Israel in 1971
The 1970s
Automation efforts flourished in the 1970s. The development of World Data Bank II (WDBII) was heavily emphasized, and more detailed data—including those for rivers, roads, railroads, administrative divisions, populated places, and attributes—were added to the growing database. Electronic typesetting capability was added, and equipment was upgraded to allow production of separation plates, vugraphs, and slides for publications and briefings. Improved efficiency led to an increase in research projects, particularly in atlases and street guides.
During the 1970s, cartographic production was primarily driven by the Vietnam war, President Nixon’s visit to China, the Arab oil embargo, the Camp David accords, the Soviet invasion of Afghanistan, and the Islamic Revolution and the seizure of US Embassy officers in Tehran in November of 1979.
The 1980s

CIA map of Central Moscow from 1980
In the 1980s, CIA’s analytical corps expanded quickly, and the demand for maps used in briefing materials and publications increased dramatically, with more complex requests and shortened time frames. During this decade, cartography made a technological transition—from a time-intensive manual system to a computer-automated system that allowed quicker turnaround times and more innovative ways of presenting intelligence. Cartographers received Intergraph interactive color workstations to design and construct digital 2D maps and 3D terrain models. A high-speed, photoscribing plotting process was added, and a modest research program was reinstated.
During the 1980s, cartographic production was primarily driven by the Falklands War, the Iran-Iraq war, the Israeli invasion of Lebanon in 1982, major acts of terror against US Marines and citizens, and US troop action in Grenada and Panama.
The 1990s
In the 1990s, the Cartography Center—with the help of advancing computer technology—provided increasingly complex products, such as 3D terrain perspectives and animation, to support finished intelligence requirements. Dependence on film decreased as digital files could be printed directly, and as maps were disseminated more widely, customer demand grew rapidly.
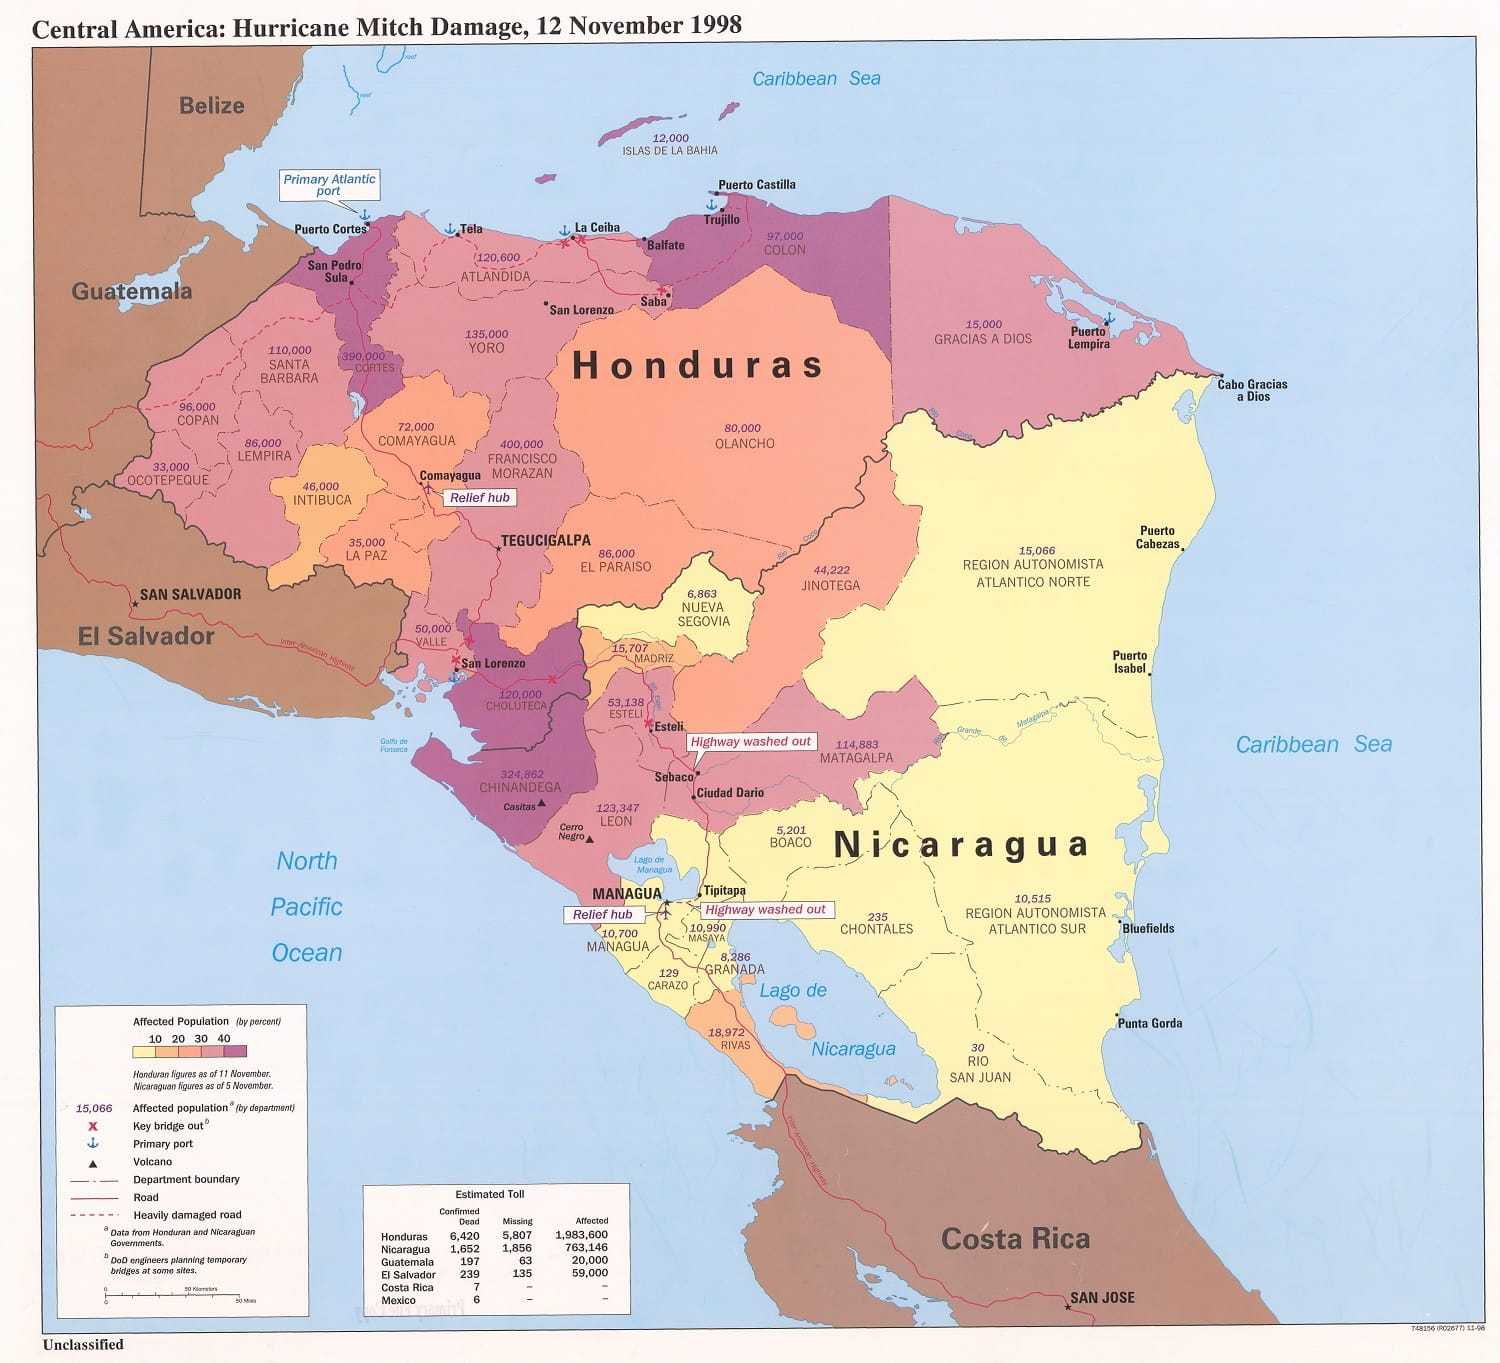
CIA map depicting damage from Hurricane Mitch in Central America, November 12, 1998
Improved computer graphics capabilities spurred greater sophistication and effectiveness in the use of color, symbolism, and design to convey intelligence stories, while the rise of geodata sources and Geographic Information Systems technology led to advancements in data classification, manipulation, and rendering.
During the 1990s, cartographic production was primarily driven by major humanitarian crises in Africa and Central America, the proliferation of WMDs, the rise of narcotics trafficking, the Middle East Peace Process, the Persian Gulf war, the breakup of the Communist Bloc, and US peacekeeping operations in Bosnia and Herzegovina.
The 2000s
With the new millennium, Cartography Center found itself at the center of a digital revolution. Hardcopy publications and briefing materials were no longer the priority as the emphasis shifted to electronic briefings and dissemination of finished intelligence.
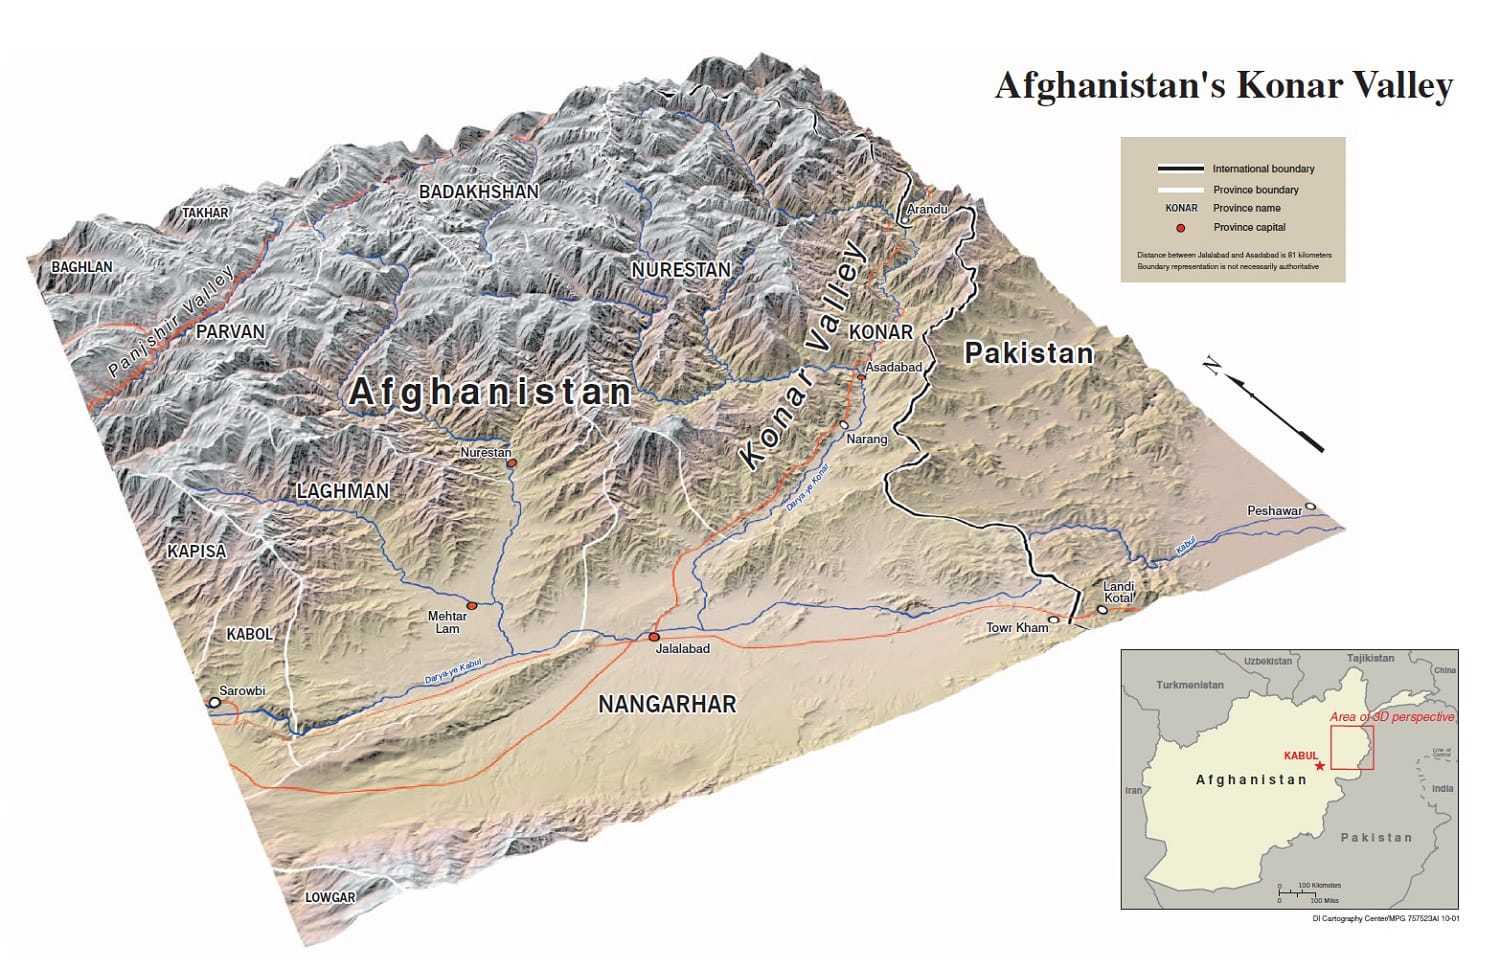
CIA 3D map of the Konar Valley in Afghanistan, 2001
As Agency products continued to exploit technological breakthroughs, cartographers constantly adapted workflow to make the best use of available software and new technologies for creating and disseminating products. The rise of global terrorism also pushed cartographers to try new avenues for portraying and conveying the complex phenomena for policymakers.
During the 2000s, cartographic production was primarily driven by natural disasters and pandemics; turmoil in Africa, the Middle East, and the former Yugoslavia; nuclear developments in Iran and North Korea; terrorism, especially the September 11, 2001 attacks, and the US operations in Afghanistan and Iraq that followed.
The 2010s

African elephant pop. CIA map 2013.
The past six years have witnessed a push toward modernization of cartography workflow and technology, especially toward dissemination on web and mobile platforms. For the most part, the Cartography Center has transitioned to the use of commercially available, off-the-shelf software and to scientific workstations, which handle software and large amounts of data more efficiently.
The Cartography Center has capitalized on the advent of US Government and open-source map data and tools, exploring and incorporating them as appropriate to improve efficiency and help visualize big data.
During the first half of the 2010s, cartographic production was primarily driven by the Ebola virus and natural disasters resulting in humanitarian crises, the rise of the Arab Spring, the Russian invasion of Crimea, and the continued spread of terrorism and the self-proclaimed Islamic State of Iraq and the Levant.
